Advance-Decline Ratio
The Advance-Decline Ratio (ADR) is a widely used market breadth indicator that provides insight into the overall strength and sentiment of the stock market. It is calculated by comparing the number of advancing stocks (stocks that close higher than their previous price) to the number of declining stocks (stocks that close lower than their previous price) over a specific period. This ratio helps traders and investors gauge the underlying momentum in the market and determine whether there is broad participation in a market trend.
How to Calculate the Advance-Decline Ratio (ADR)
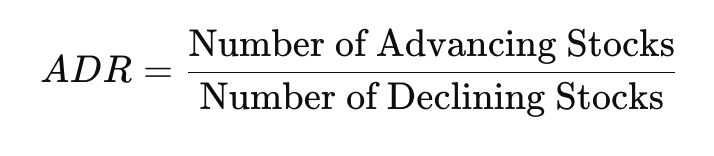
The formula for the Advance-Decline Ratio is straightforward:
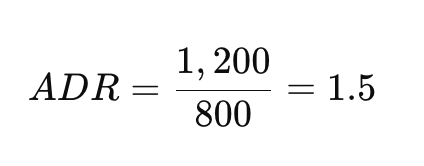
This ratio shows that for every 1 declining stock, 1.5 stocks are advancing, indicating a bullish sentiment in the market.
Importance of Advance-Decline Ratio for Intraday Trading
In intraday trading, timing and market sentiment are crucial. Traders need to assess not only individual stock movements but also the broader market to make informed decisions. The ADR is particularly useful for intraday traders because it provides a quick snapshot of market breadth and the strength of a trend. Here’s why the ADR is important for intraday trading:
- Market Sentiment Gauge: ADR reflects the underlying sentiment. An ADR greater than 1 indicates more advancing stocks, suggesting bullish sentiment, while an ADR below 1 shows a bearish sentiment. This can help traders decide whether to take long or short positions.
- Trend Confirmation: ADR helps confirm market trends. If a stock index is rising, but the ADR is below 1, it might indicate that the rally is limited to a few stocks, which could be a sign of weakness. Conversely, if the index is rising with an ADR above 1, it confirms broad market participation, suggesting a stronger uptrend.
- Detecting Market Reversals: When the ADR diverges from the price movement of the market or an index, it can signal potential reversals. For instance, if the market is rising, but the ADR is declining, it could indicate that fewer stocks are supporting the rally, signaling a potential market reversal.
- Risk Management: By using ADR, traders can avoid trading during low-momentum or indecisive market conditions, reducing the chances of being caught in choppy price action.
How to Use the Advance-Decline Ratio for Intraday Trading
1. Assessing Market Strength Before Entering a Trade
Before initiating an intraday trade, traders can check the ADR to gauge overall market sentiment. A high ADR (>1) indicates that more stocks are advancing, suggesting a bullish environment. This is a good time to focus on long positions, especially in stocks or sectors that are showing upward momentum.
Conversely, if the ADR is below 1, it indicates bearish sentiment, and traders should look for short opportunities in weak stocks or sectors.
Example:
- Market Condition: Let’s assume the ADR is 1.8, which means 1.8 stocks are advancing for every 1 stock that is declining.
- Trade Setup: This shows a strong bullish sentiment. As a trader, you might focus on buying stocks with positive price action, such as those breaking above key resistance levels.A stock showing a breakout above its resistance with strong volume would be an ideal candidate for a long position in such a market.
2. Identifying Divergences for Potential Reversals
Divergence between the ADR and the price movement of a major index (such as the Nifty 50) can signal a potential reversal. If the index is rising, but the ADR is falling, it suggests that fewer stocks are participating in the rally. This can be a warning sign of a weakening market and a potential opportunity to short stocks.
Example:
- Market Condition: The market index is rising steadily, but the ADR has dropped from 1.5 to 0.9, indicating that fewer stocks are advancing.
- Trade Setup: This divergence signals a weakening rally. You might look for stocks that have had strong runs but are showing signs of exhaustion, such as failure to break above resistance or bearish reversal patterns like double tops or head-and-shoulders. These stocks could be good candidates for short trades as the market potentially reverses.
3. Using ADR in Combination with Other Indicators
While ADR is a powerful tool, it’s often most effective when used in combination with other technical indicators, such as moving averages, relative strength index (RSI), or volume analysis. By combining ADR with these indicators, traders can get a more comprehensive view of the market and improve their decision-making process.
Example:
- Market Condition: ADR is 1.2, suggesting a slight bullish bias, but the RSI on a particular stock is overbought (above 70).
- Trade Setup: In this case, you might avoid going long in the stock, despite the positive ADR, because the overbought RSI indicates that the stock might be due for a pullback. Instead, you could wait for a correction or look for a short-term short opportunity if other bearish signals appear.
Example of Intraday Trading with ADR
Let’s assume you are an intraday trader monitoring the ADR during the trading day. The market opens with a high ADR of 2.0, indicating a strong bullish sentiment. You decide to enter a long position in a stock that has shown upward momentum in pre-market trading and breaks above its first resistance level within the first hour of trading.
As the day progresses, you continue to monitor the ADR, and it remains above 1.5, confirming that the overall market is still strong. You hold your long position, and the stock continues to rise. However, in the afternoon, you notice that the ADR starts to drop below 1.0, signaling that the market is losing strength. This divergence alerts you to take profits on your long position before the broader market weakness affects your stock.
Where to Check the Advance-Decline Ratio
To effectively use the ADR in your intraday trading strategy, you need access to real-time or daily ADR data. One reliable source for checking the ADR is Moneycontrol, which provides comprehensive market data, including heat maps and advance-decline ratios for major Indian stock exchanges like NSE and BSE. You can monitor the ADR and other market breadth indicators by visiting their dedicated page:
This resource offers up-to-date information, allowing you to make timely and informed trading decisions based on the current market breadth.